Big Data Analytics and Visualization

Feed.fm case study
Client
Feed Media Group (US)
Year
2018
Team
2
7 mln
Events processed daily
ML
Algorithms
ELK
Stack
Big Data Visualization Case Study
Feed.fm platform allows to enhance digital experiences with authentic media background.

Client

The market of digital solutions and services for improving customer experience is crowded and diverse. Therefore, it’s hard to present a unique product in this competitive space. Hard, but not impossible.

Feed.fm created an innovative solution for business to augment digital experiences with motivational and engaging music accompaniment tailored to audience’s preferences and situational needs. The company allows the network of clients to integrate their apps and web systems with Feed.fm platform and enhance people’s digital experiences with authentic media background.

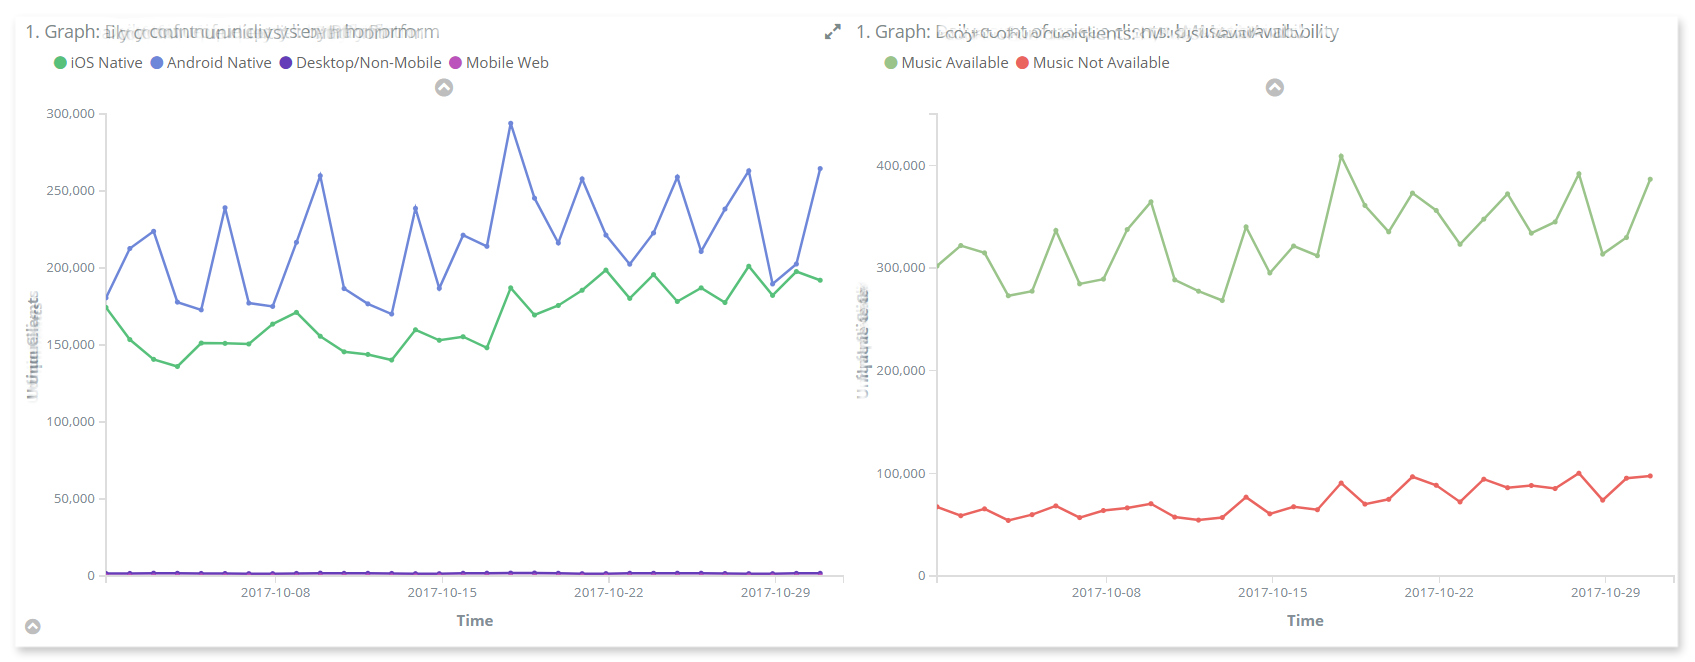
Our work with Feed.fm could be one of the best data visualization examples which brought viable results. Feed.fm has been collecting datum since 2015. In fact, big data became one of the core platform’s influencers that make music enhancement truly user-oriented and impactful, conversion and business-wise. In this respect, both legacy and real-time data need representation and interpretation. That’s how Digiteum was assigned to create Feed.fm big data analytics and visualization and help the company and its clients turn raw playback data into valuable insights. Later, this case became a good big data visualization example to show how interpretation of data can help a business or organization grow.

data analytics and visualization
Feed.fm dashboards are good examples of data visualization which helps business improve conversion.

First stage data visualization

At the first stage, Digiteum used the combination of Elastic Stack solutions (Elasticsearch, Logstash and data visualization application Kibana) to enable platform’s big data initial collection, systematization, analysis and visualization for both Feed.fm team and the company’s clients.

On the one side, the information from individual application media playback – sessions length, number of unique listeners, audience behavior and preferences, conversion rate, etc. – comes to the client’s individual login-protected admin dashboard. This data represented in visual charts and comparison-based graphs provides real-time performance reporting and allows the users of Feed.fm platform monitor and control the efficiency of their applications. You can see playback data visualization example in the image above.

On the other side, big data combined from all clients and applications comes to Feed.fm’s internal dashboard. This feed allows editorial teams to compile custom track lists relevant to clients’ needs and their customers’ expectations, continuously improve the technology behind the platform and eliminate risks, and in general, analyze and understand how media augmentation affects customer engagement, loyalty and conversion.

data visualization
PDF data recognition algorithm
Advanced analytics and pattern recognition make it simple to get and interpret data.

Advanced data analytics, visualization and impact

The next stage of the project required advanced data analytics and management tools and, as a result, enabled more profound, insightful work on the platform’s data.

At this step, Digiteum team first takes data and statistics from Elastic Stack, processes this data using Apache Spark analytics engine and builds various aggregations – data sets associated with one platform user that illustrate certain performance patterns in given term – day, month, etc. For example, these aggregations can show how music playback activity influences user engagement or how much time active users who play music spend in the app compared to less active users. This also is an example of data analytics which applies advanced algorithms. In order to determine patterns and build aggregations, the team relies on mathematical statistics (one of the methods used in Machine Learning to find dependencies and make predictions).

Then, easy-to-read and understand aggregations with data insights are stored in Apache Hadoop HBase. This storage solution is perfect for time series data produced by Feed.fm for many reasons, including data optimization capabilities and SQL integration. Visualization of these insights will take place at the next stage of the project and will make another cool data visualization examples that illustrate how business can benefit from big data.

Advanced analytics, pattern recognition and soon visualization of more detailed and complex data insights have significant value for both Feed.fm, the platform’s clients and millions of end-users. On one hand, it allows Feed.fm team to quickly interpret reaction to changes in platform performance and adjust improvement efforts for great results. On the other hand, the clients of Feed.fm get deeper insights on customer engagement that allow them to make relevant data-driven decisions and choose the approach to web or app optimization, conversion improvement and profit maximization.

data analytics and visualization
Feed.fm and its clients make data-driven decisions on further development.

Highlights

  • Data visualization case study: custom big data representation and visualization based on the configuration of Elastic Stack data solutions.
  • Advanced data analytics and management based on Apache Hadoop tools and mathematical statistics used in Machine Learning.
  • More than 7 million events processed daily, almost 3.5 billion records stored in total up to this point.
  • Two-sided data representation: individual login-protected dashboard for each client and closed performance report on all applications connected to Feed.fm platform.
  • Digital tool that allows Feed.fm platform users to make data-driven decisions on website and app optimization, customer engagement and conversion improvement.
Looking for skilled big data engineers to help you make sense of your data? Let's talk!
0
0
image
https://www.digiteum.com/wp-content/themes/blake/
https://www.digiteum.com//
#dd170f
style1
default
Loading posts...
/var/www/html/
#
on
none
loading
#
Sort Gallery
https://www.digiteum.com/wp-content/themes/blake
off
yes
yes
off
Enter your business email here
on
off